Preview
Preview is the area that supports robot coding — checking the robot connection status, the code, the camera, the console, and so on.
Below we explain the features available in each tab.
Connections
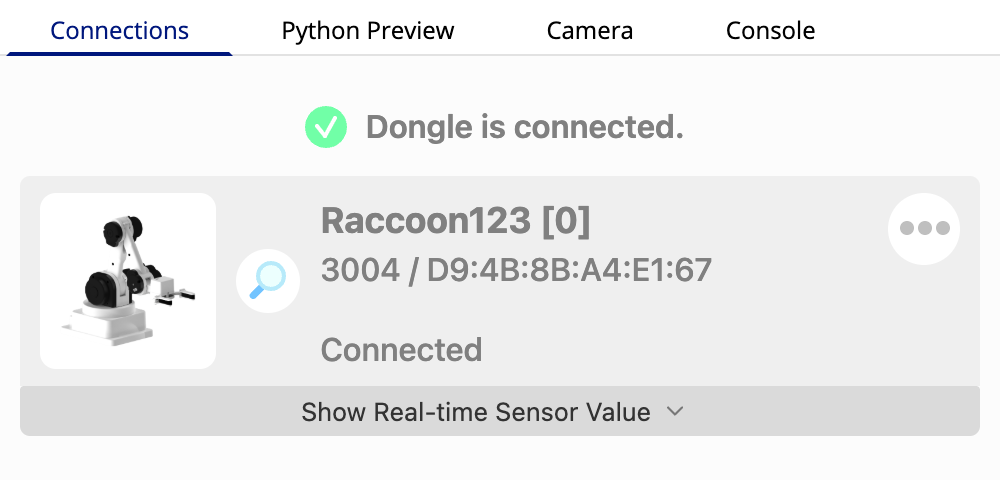
In the Connections tab you can check the information of the robots that are currently connected.
If you click Show Real-time Sensor Value, you can check the robot's sensor values in real time as a graph or as numbers.
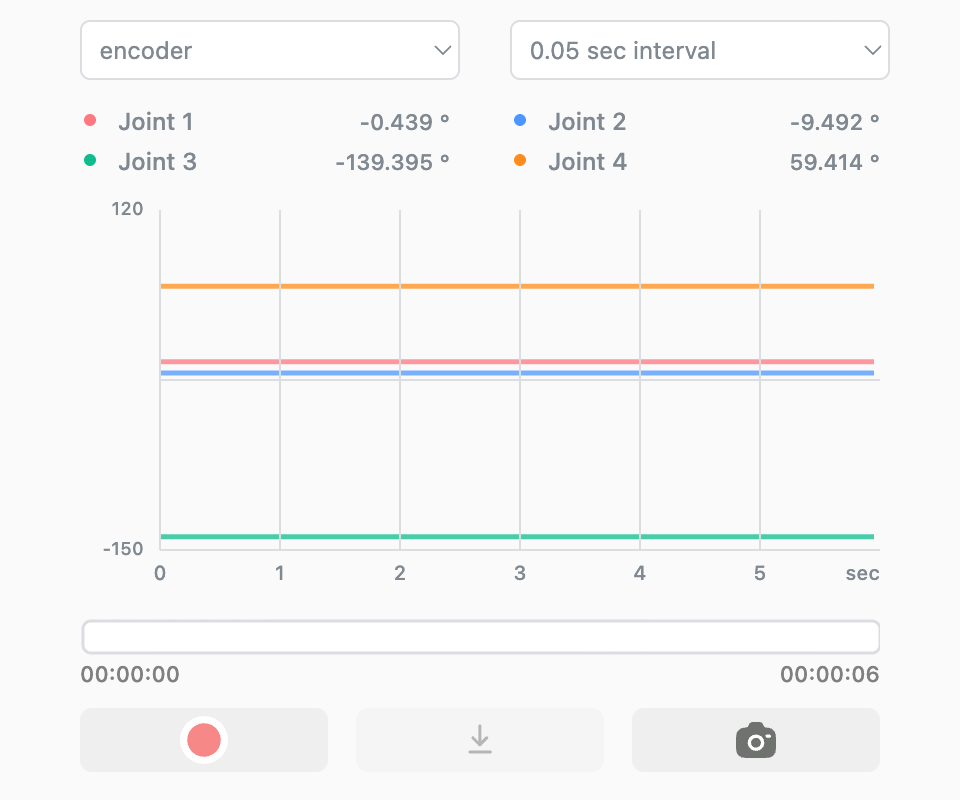
You can select the sensor to inspect; the kinds of sensor supported differ from robot to robot.
Depending on the sensor you select, the graph and the way the data is shown change automatically to match that sensor's values.You can select how many seconds apart to check or record the sensor values.
Depending on the interval you select, the maximum time over which data can be recorded and shown on the graph changes.If you hover the mouse over the sensor graph, you can also see the sensor value at that point in time in real time.
Start/stop recording: records the sensor data.
Export: saves the recorded sensor data (.csv) and the graph view (.png) as files.
This feature is available only after you have recorded data.Capture: saves the current graph view (.png) in real time.
You can record how the sensor values change, and save the recorded data file and the graph view as files.
Python Preview
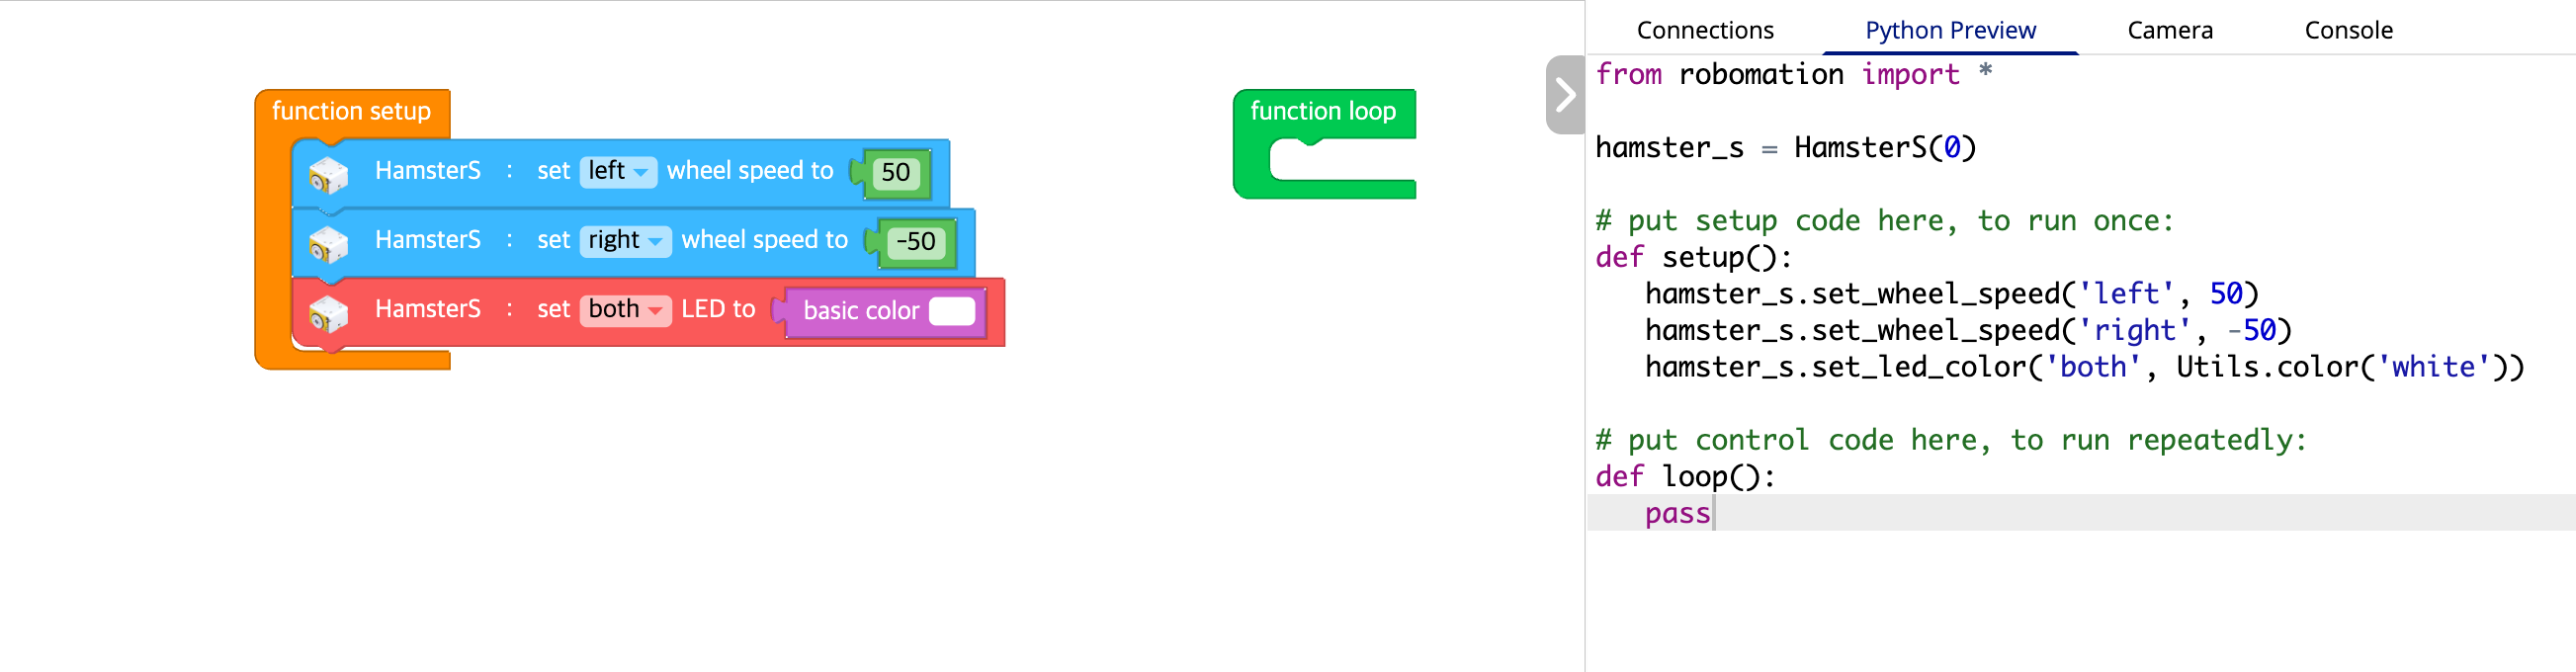
In Python Preview you can see in real time how your blocks are converted into Python code as you add or remove them.
By seeing how blocks turn into code, you can learn coding syntax more easily.
※ Python Preview is provided only in the block coding editor.
It is not provided in the Python editor, because there the user writes the code directly.
Camera

In the Camera tab you can see the view of a camera connected to your PC in real time.
This feature is enabled only when you have added an extension module that uses the camera to the program, and a camera module is then created in the Camera tab.
In each camera module you can use the following features.
- You can choose one of the cameras currently available on your PC and show its view.
- You can show or stop the camera view with the On / Off button.
- You can change the camera resolution.
Console
In the Console tab you can see the log messages printed while the program runs and the scope graphs in real time.
This tab is used for debugging, monitoring sensor values, graph-based analysis, and so on.
Log
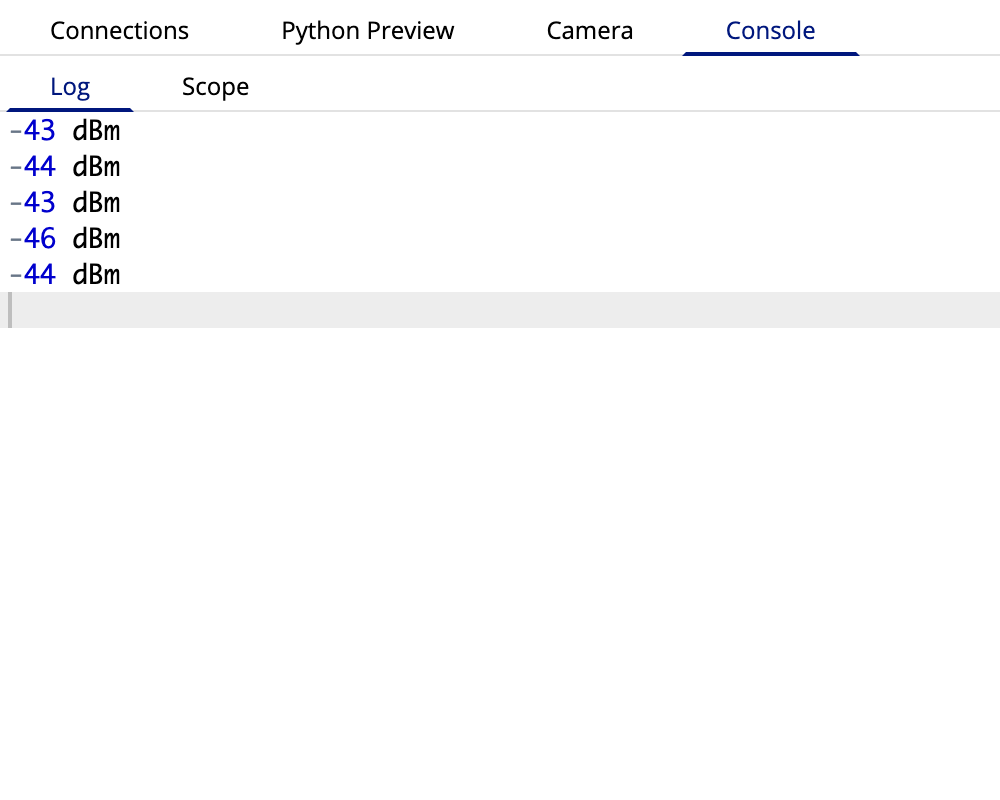
Using the log block, you can print a text or numeric value together with a tag you specify in the console log area.
Scope
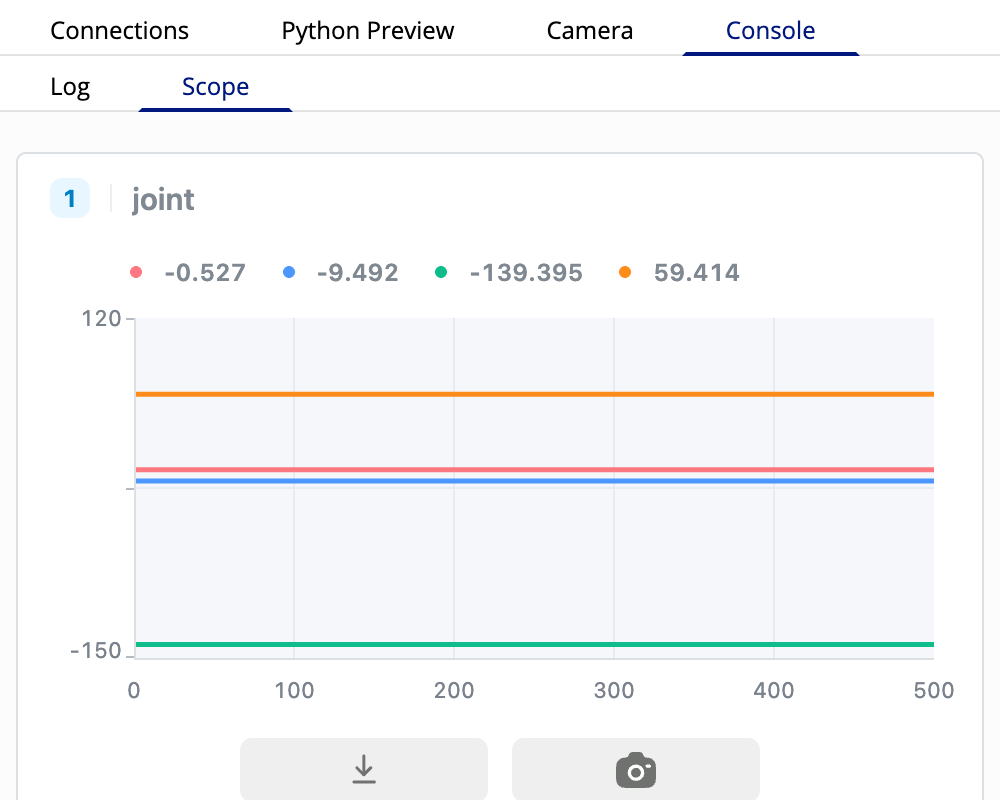
Using the scope block, you can express numeric values per tag as a real-time graph.
By setting the minimum, the maximum, and the graph color, you can visually check how the value you want changes.